Overview
I am currently working with IBM Storwize V7000, this is a mid range SAN and is capable of utilising Fibre Channel (4x 8Gbs FC per controller) or iSCSI (2x 1Gbs and 2x 10Gbs NIC per controller) for block storage. There is also a V7000 Unified which provide File storage Network Attach Storage (NAS).I am working with the non unified version with 10Gbs iSCSI, in a VMware environment (ESXi 5.0U1). The VMware hosts I am using are IBM x3550M4 with a Emulex VFA III (Virtual Fabric Adapter)10Gbs Network Card. This Emulex card along with the 10Gbs switch's which are IBM G8124E , can separate each of the 2 interfaces on the Emulex network card in to 4 channels giving 8 Virtual Nics to the VMware Host. The Channels can have the bandwidth split up into a % of the the 10Gbs in increments of 10%. I am using the following
Only 3 of the channels (index) are in use.
Channel 1 index 1, 40% = 4Gbs, LAN Traffic
Channel 1 index 2, 20% = 2Gbs, vMotion
Channel 1 index 3, 40% = 4Gbs, iSCSI Software initiator (VMware and V7000 don't support hardware initiator)
Channel 2 index 1, 40% = 4Gbs, LAN Traffic
Channel 2 index 2, 20% = 2Gbs, vMotion
Channel 2 index 3, 40% = 4Gbs, iSCSI Software initiator (VMware and V7000 don't support hardware initiator)
Each channel is in a separate switch for redundancy.
The bandwidths for each index are managed on the switch and can be changed on the fly if need be, IBM G8124E or compatible switch are required if you want to configure the bandwidths at switch level. The bandwidths can be done at card level but I am not doing that.
This type of set up reduces the amount of cabling required at the back of the server as only 2x 10Gbs SFP+ cables are required, these can be either fibre on copper.
Out of the box set up
After the initial installation and once the vm' guests started to build up and start to put load onto the IBM Storwize V7000 high latency was experienced on the hosts. After using Tivoli TPC (Tivoli Storage Productivity Centre) it was showing that the SAN was being slow to respond to the hosts.This was confirmed with a support call to IBM storage and VMware support teams.
Performance Tuning
A VMware host was isolated and used for performance testing and tuning purposes, the following tasks we done.Windows Guest running IO Meter, IO Meter can be downloaded from here. I also used a workload that is available from VMware which is available here VMWare Workloads
I also created my own workload utilising 64K blocks to mimic a workload that was experiencing issues, which are included in the above workloads link.
Before the baseline was established, the only host changes that were applied were Jumbo Frames (MTU 9000) to the NICs and the vSwitches that the iSCSI connections are connected to. also TCP Ack Delay was disabled on the iSCSI connections.
MTU 9000 can be set in the following way.
I am using VMware 5.0U1, other versions may vary.
1. On the vCenter client go to Hosts and Clusters,
2. Select the host you are working with,
3. Click in the Configuration tab
4. Under Hardware select Networking
5. Go to properties of the vSwitch
6. The following should appear, select the vSwitch and then click edit
7. The following should appear, the MTU will be at 1500 you should change this to 9000,
Note your switch needs to be able to support Jumbo Frames and be configured to do so before changing this setting, the IBM G8124E by default accepts Jumbo Frames. this is only required on the Storage vSwitches

TCP Ack Delay can be disabled in the following way
1. On the vCenter client go to Hosts and Clusters,
2. Select the host you are working with,
3. Click in the Configuration tab
4. Select under Hardware, Storage Adapters
5. Under the Storage Adapters select the iSCSI Software Adapter
6. Under Details click on properties
7. The following should appear, click on advanced.
8. The following should appear, scroll down to the bottom.
9. Remove the tick from the DelayedAck section, iSCSI option: Delayed Ack: then click on OK
The above workloads were used to establish a base line, results are bellow.
Baseline results
After the Jumbo Frames and TCP Ack delay were applied there was a significant improvement which is the results bellow before other changes.

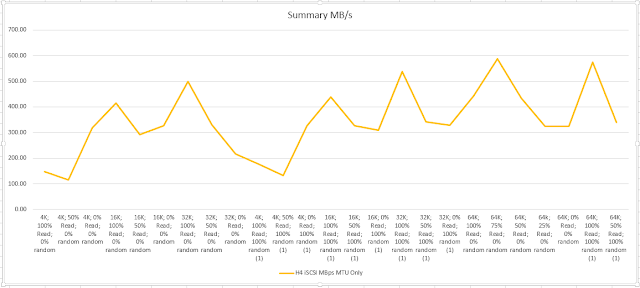
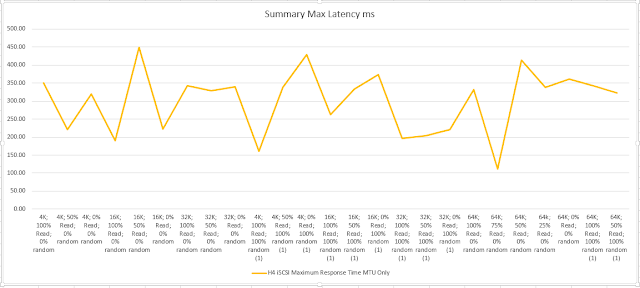
Lots of drivers and firmware versions later I am now able to achieve the following results with the same bench mark.
Summary of results
As a whole the results with the updated drivers and firmware are an improvement there is 1 spike on the maximum latency to ~880ms but I think that was a one off, I am keeping an eye on the performance at the moment if it changes I will post details.
Old Firmware and Driver Versions
VMware ESXi 5.0U1 (5.0.0, 623860)
IMM 1.65
uEFI 1.2
DSA 9.24
Emulex Adapter Firmware 4.1.344.3
IBM Storwize V7000 6.1.4.4 plus iFix (ifix_61633_2076_75.3.1303080006)
VMware Emulex Drivers
ima-be2iscsi 4.2.324.12-1OEM.500.0.0.472629 Emulex VMwareCertified
net-be2net 4.6.142.10-1OEM.500.0.0.472560 Emulex VMwareCertified
scsi-be2iscsi 4.2.324.12-1OEM.500.0.0.472629 Emulex VMwareCertified Updated Firmware and Driver Versions
VMware ESXi 5.0U1 (5.0.0, 821926)
IMM 1.97
uEFI 1.2
DSA 9.33
Emulex Adapter Firmware 4.6.166.9
IBM Storwize V7000 6.1.4.4 plus iFix (ifix_61633_2076_75.3.1303080006)
VMware Emulex Drivers
ima-be2iscsi 4.6.142.2-1OEM.500.0.0.472629 Emulex VMwareCertifiednet-be2net 4.6.142.10-1OEM.500.0.0.472560 Emulex VMwareCertified
scsi-be2iscsi 4.6.142.2-1OEM.500.0.0.472629 Emulex VMwareCertified


I came across this while doing some Storwize research. Thanks for the article and taking the time to insert all the screenshots.
ReplyDeleteOur storage team put together a blog article that has a cross reference chart of part numbers and features for the drives in the Storwize line.
We thought your readers might find it useful.
The link is here
http://www.maximummidrange.com/blog/storwize-drive-comparison-chart/2854
if you want to post it.
If not, please delete. We are not trying to spam or cause any trouble.
Thanks and best regards,
Maximum Midrange
Max thanks for the comments, I think your information about disks etc may be useful for my readers.
DeleteGreat post. I'm a bit freaked out right now because in a very similar configuration (see below), I'm getting ~1500 IOPS, an order of magnitude below your results.
DeleteQuestion: what speed of drives are you using? Are you using EasyTier? Any other details regarding the configuration of the storage?
Found a slideshow from IBM showing 21,000 IOPS (Disk 70/30 read/write), but with 120 x 15K drives(!), so no idea how that would translate to real-life numbers.
My setup:
v3700 using 4 x 1 GB iSCSI per controller (x2)
VLA III configured identical to yours, but at the adapter level through UEFI
D-Link switches (x2) with SPF+ cables
14 x 10K Near-line SAS left "automatic" (RAID 5)
Thanks for your comments, I am using EasyTier with 2x 400GB SSD disks on my SAS Pool not my NLSAS pool, I have 25x 15k RPM (1 hotspare) in my SAS pool which are the bench marks above, I am testing with 26 different workloads to simulate real load, my NLSAS pool has 21z 1TB 7.2k rpm disks and it can achieve <50,000 IOPS with 4k blocks 100% read, 64k Blocks and 50/50 read/write I can achieve >10,000 IOPS. What are you Mdisk sizes?
Deletegravyface, I have my performance test details near the top of this page. http://itbod73.blogspot.co.uk/2013/10/vmware-50u1-ibm-v7000-iscsi-performance.html this includes the workloads that I am using with IO Meter to test with. Hope this helps.
DeleteWell after a long (long) journey of firmware updating, experimentation and doubting my configuration decisions, I'm happy (reluctant?) to report that I can boast 97,000 IOPS at 4K 100% read, 0% random.
ReplyDeleteMajor game changer seems to be changing the number of IOPS to send to each path in ESXi multipath configuration (i.e. esxcli deviceconfig and setting iops to 1 per path). Watching my iSCSI interfaces with the Solarwinds SNMP bandwidth monitor (great free tool) I saw my 1GbE interfaces go from 10-15% utilization to 40-50% and even saturating a few of the links...
...but I'm skeptical at the results: Mdisk IOPS are extremely low, so I'm guessing this is all cache reads I'm seeing at 4K.
Also, 1 single I/O per path seems like crazy talk; I think I'm going to back that off to maybe 100. Based on an analysis we did, this customer was seeing ~16K average I/O size and 76% read, and peak IOPS around ~3K (during backups at night), so I'm feeling much more confident with this setup, but still have a couple days left of tinkering before we put it on-site and start building VMs.
One thing: I enabled the Turbo Performance trial and didn't see really that much improvement; getting multipathing going correctly (that was my bad) was significant for IOPS, but setting the 1 per path option was a massive, massive improvement that can't be ignored.
gravyface Im glad you got it working with good performance now, did you use my IO Meter workloads. I think those results are probably majority cache hits. My numbers are coming from a v7000 which has load of lots of applications running on it at the same time.
Deletehello how did you get your iometer results into the graphs ?
ReplyDeleteJason sorry for the very late repose, I haven't been updating this site for a while, basically stripped out the unwanted data from the CSV files (I used to have a macro that did this) and then produce graphs in Excel.
ReplyDelete